
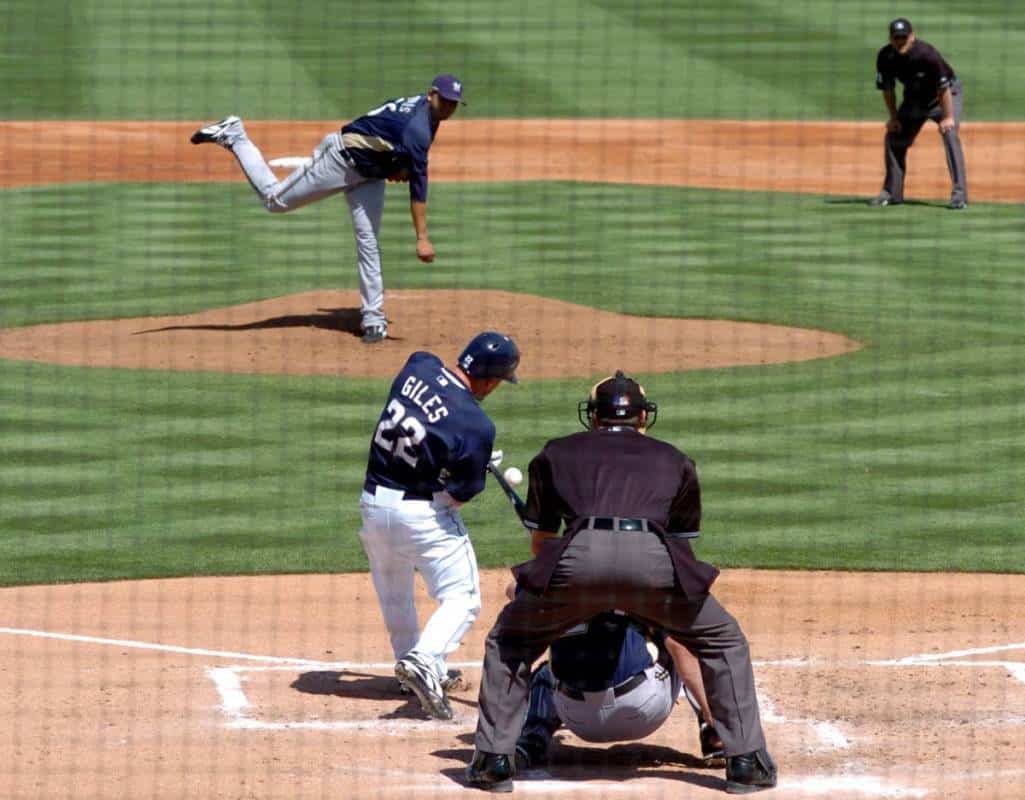
If you’re around baseball much, one of the things that you’re bound to hear is that you want pitchers to have low ERAs. Seems simple enough, right?
Well, maybe not, because different pitchers pitch in front of defenses of varying quality and in ballparks whose pitching conditions vary, leading to another statistic to evaluate pitchers: FIP.
So, what is FIP in Baseball?
Fielding Independent Pitching, or FIP, is an advanced statistic that judges a pitcher’s ability based solely on his strikeouts, unintentional walks, hit-by-pitches, and home runs allowed. The statistic aims to remove all other forms of outcomes to account for a pitcher’s good or bad luck.
Sound confusing? That’s understandable, but don’t worry, we’ll dive in and explain FIP in much more detail.
Why Is FIP Used?
So far, we know that FIP only factors in how many home runs and unintentional walks a pitcher allows, as well as how many batters he hits, while also factoring in how many batters he strikes out. But why do they only use these figures?
FIP only uses a narrow scope of statistics because home runs, walks, and strikeouts are the so-called “three true outcomes,” which are called that because the only factors involved are the pitcher and batter. This cuts out any results that are the result of luck or defense, both good and bad.
In addition to the three true outcomes, FIP adds hit-by-pitches, because, like walks, the batter winds up on first base and is solely the result of pitcher wildness. Likewise, intentional walks are excluded (subtracted from the overall walk total) because they are almost always ordered by the manager, instead of at the pitcher’s discretion.
This is because, according to Fangraphs, researchers discovered that a pitcher’s luck based on whether a batted ball is fielded or not (which is out of his control) often varies wildly from year to year.
Because of this, FIP was devised as a way to look at a pitcher’s long-term ability based on the factors he can control, which tended to be more consistent over longer periods.
Put another way, the research found that a pitcher’s opposing batting average on balls in play, or BABIP, often varied wildly.
This statistic, which accounts solely for all balls the batter puts in play (eliminating all at-bats that end in a strikeout or home run) often can show whether a pitcher is lucky or unlucky based on whether balls are finding the outfield grass or finding a glove.
How Do You Calculate FIP?

Now that FIP is explained and seems somewhat straightforward – how do you calculate it?
Well, because it involves removing components from a traditional stat line, as well as adjusting for the league average each season, it’s a little more difficult than a traditional ERA calculation.
The equation for FIP is FIP = ((13*HR)+( *(unintentional BB+HBP))-(2*strikeouts))/innings pitched + league constant. To find the constant, you’ll need another equation: FIP Constant = league ERA-(((13*league home runs)+(3*(league walks+league HBP))-(2*league strikeouts))/league innings pitched).
Okay, so that’s…confusing. Let’s unpack this. For home runs, unintentional walks, hit-by-pitch, and strikeouts, these are simple numbers that you can readily find on a pitcher’s line.
As for the multipliers (13*HR or 2* strikeouts, for example), these are assigned based on their impact on a game, because a home run will typically have much more of an impact than a walk or a strikeout.
As for the league constant, this is a number that stays fairly constant from year-to-year (it has fallen between 2.962 and 3.240 every year since 1994), as reflected by the “cFIP” column in this table. Because this figure, again, only factors in the three true outcomes (and HBP), it is not nearly as volatile as most other statistics, without clear peaks and valleys visible over shorter spans.
For an example, let’s look at Jacob deGrom’s 2019 season when he won his second straight Cy Young.
Using the Fangraphs table for the league constant (3.214), we can fill out the formula like this: FIP = ((13*19 homers)+[3*(43 unintentional BB+7 HBP))-(2*255 strikeouts))/204 innings pitched + 3.214 league constant. The result is a FIP of 2.67, compared to his actual ERA of 2.43.
What Is Considered a Good FIP?
Similar to conventional ERA, a pitcher wants to have a low FIP, because that tends to bode well for future performance. Also, FIP can be judged on a similar scale to ERA in terms of what is good and bad.
Like ERA, a FIP below 4.00 generally is good, while a FIP above 5.00 is poor and a FIP at 3.00 or below is excellent. Additionally, FIP is designed so that the leaguewide FIP matches the league ERA, which is why the ever-changing constant is needed in year-to-year calculations.
Consequently, because the league ERA in 2019 was 4.49, the average FIP was also 4.49, because FIP is designed to better accommodate leaguewide pitching conditions in a given year.
Because ERA and FIP tend to closely follow each other, annual league leaders in FIP usually have a FIP that resembles a league-best ERA, which can fluctuate year-to-year. Consequently, the leaguewide FIP leaders from 2000-19 have had figures fluctuate from 1.81 (Clayton Kershaw, 2014) to 3.26 (Corey Kluber, 2016), while ERA leaders have ranged from 1.66 (Zack Greinke, 2015) to 3.05 (Freddy Garcia, 2001).
Likewise, because FIP is designed to be more consistent on an individual level from year to year, while ERA can wildly fluctuate due to a variety of factors, it is common for pitchers to lead in either ERA or FIP, but not the other.
Consequently, of the 40 pitchers to lead their league in ERA from 2000-19, only 14 also led the league in FIP the same season.
Because ERA can be wildly influenced by luck, it’s more likely to vary year-to-year, though a pitcher’s FIP can vary by either striking out or walking more batters than usual, or if his home run rate changes.
Since strikeouts and homers have spiked in the past few years, those are the two rates that have been the ones to watch lately.
That said, the home run rate tends to be the rate that fluctuates the most year-to-year for individual pitchers, leading to another batch of statistics to better reflect that.
What Is xFIP?
As we said, a sudden spike in a pitcher’s home run rate can negatively affect their FIP, so naturally, the very smart people who find new stats to create created a couple of tweaks to FIP to account for factors that can skew it, perhaps in a misleading manner.
One additional statistic is called Expected FIP (xFIP). xFIP is a measure of FIP that compares a pitcher’s rate of home runs to fly ball (HR/FB or home run rate) with that of the league average to produce the expected FIP if the pitcher’s home run rate mirrored that of the league average.
xFIP can be particularly useful in the case of pitchers who give up a significantly varying amount of home runs from one season to the next or pitch in small ballparks that regularly see balls leave the yard that would stay in the yard in most other parks.
The formula to calculate xFIP is: xFIP = ((13*(Fly balls * league HR/FB%))+(3*(BB+HBP))-(2*strikeouts))/innings pitched + league constant. The xFIP formula is pretty much the same as the FIP formula (including the constant), except that the pitcher’s raw total of home runs is replaced by ((13*(Fly balls * league HR/FB%)).
In this case, the HR/FB rate in 2019 was 15.3% of all fly balls being homers. As a result, Yu Darvish of the Chicago Cubs, who allowed an MLB-worst 22.8% of his fly balls to leave the yard, posted a 3.39 xFIP while his actual FIP was a more modest 4.18 FIP.
On the other end of the spectrum, Marco Gonzales of the Seattle Mariners posted a nearly identical 4.15 FIP, but he allowed homers on just 9.3% of his fly balls, giving him an xFIP of 5.11, nearly a run worse than his FIP, and nearly two runs worse than Darvish’s xFIP, despite very similar FIPs.
However, xFIP is not perfect, because it doesn’t account for the quality of contact induced by pitchers. In 2019, the 12 pitchers who induced the weakest contact (lowest average exit velocity) all had HR/FB rates below the league average. While the hardest contact list doesn’t have nearly as much correlation relating to HR/FB rates, four of the six pitchers allowing the hardest contact did have HR/FB rates above the league average.
While xFIP serves as a tool to normalize FIP among pitchers with wildly different HR/FB rates, there is another stat out there that takes it a step further.
What Is FIP-?
There is another cousin to FIP that aims to tackle the issue of comparing pitchers who pitch in ballparks that vary in how friendly they are to pitchers.
FIP Minus or FIP-, is a statistic that takes FIP, compares it to the park factors of that pitcher’s home park, and puts it on a scale relative to 100 as the league average. Unlike FIP and xFIP, FIP- is not presented in a similar form to a standard ERA.
Simply put, FIP- is similar to ERA+ (or adjusted ERA) in that they both use 100 as a baseline while factoring in how effective they were compared to league average and factoring in park factors along the way. However, one noticeable difference is that the scales go opposite ways.
Namely, an ERA+ above 100 is above-average, while a FIP- results in numbers below 100 being above-average. In other words, if a pitcher were to have an ERA+ of 105 and a FIP- of 95, he would be 5% better than the rest of the league in both categories.
The calculation for FIP- goes like this: ERA Minus = 100*((ERA + (ERA – ERA*(park factor/100)) )/ AL or NL ERA). In this case, the average ERA for either the American or National League is used (depending on which league the pitcher is in) and the park factor of their home park.
By using park factor, a Colorado Rockies pitcher would get a break on ERA- for pitching in a stadium with a park factor of 118 (18% more offense than average) in 2019, while a San Francisco Giants pitcher will have their results adjusted the opposite way for pitching in a stadium with a park factor of 90 (10% less offense than average).
In this context, with 100 as average, a FIP- of 90 or below is very good, while anything about 110 is poor, meaning that Oracle Park makes the average pitcher above average just by being pitcher-friendly, while Coors Field makes the average pitcher perform very poorly just by being a mile high, resulting in the ball flying.
How Reliable Is FIP?

With all of this said, the question is how reliable is FIP in determining how effective is, or rather, how effective a pitcher should be? Well, the answer is that on its own, it’s better than just simply looking at a pitcher’s ERA.
FIP is excellent at indicating warning signs that a pitcher is either over-or-underachieving over a shorter period of time and gives a better indication of their true abilities. With that said, FIP does have shortcomings by the fact that it doesn’t take into account different types of pitchers.
Namely, FIP doesn’t care how good a pitcher’s defense is behind him, how hard his pitches are being hit, whether they’re hit on the ground or in the air, whether a flyout would’ve been a home run in a smaller park, or whether a home run is hit with the bases empty or the bases loaded.
Also, certain players can “break” FIP, if you will. For example, take Hall of Famer Mariano Rivera. Rivera pitched for 19 years racking up saves (a record 652 of them) with essentially one pitch—a devastating cutter.
Rivera didn’t walk many batters, but he also averaged less than a strikeout per inning, a rarity for a lights-out reliever. Instead, he used that cutter to bore in on right-handed hitters or away from lefties and induce weak contact.
For his career, he induced significantly more ground balls than the MLB average, while his HR/FB average is a mere 5% for his entire 19-year career.
Because FIP likes strikeouts and doesn’t like weak contact, Rivera posted a lower ERA than his FIP in 14 of his 19 seasons, including five seasons when his ERA was more than a run lower than his FIP.
Granted, as a closer, he pitched more than 80 innings just once (107.2 innings in 1996), but for his career (nearly 1,300 innings), Rivera posted an excellent 2.76 FIP. However, he also posted a 2.21 ERA, beating his FIP by more than half a run.
Another example is Chicago Cubs pitcher Kyle Hendricks, who averages 87 MPH with his fastball (3rd percentile of MLB pitchers in 2020) and has seen his already modest strikeout rate go down while just about everyone else is striking out more hitters, but for four straight seasons, he ranked near the top in lowest average velocity.
Consequently, as of the end of the 2020 season, Hendricks has beaten his FIP in six of seven seasons (including three seasons beating it by at least half a run). Hendricks has a career ERA of 3.12 compared to a career FIP of 3.53.
On the other hand, there are also players like John Burkett, a solid pitcher with 166 career wins who retired in 2003. He posted a modest strikeout rate for his time, but good home run and walk rates. His career FIP wound up at a respectable 3.85, but his career ERA wound up nearly half a run higher, at 4.31.
How? Well, there’s no easy answer, but the most readily available explanation is that he allowed a lot of hits that stayed in the yard.
In particular, from 1997-99, Burkett posted a 3.92 FIP over those seasons, but his overall ERA was an unsightly 5.26 ERA, thanks in part to allowing a staggering 11.1 hits per 9 innings, despite his other rates being in line with the rest of his career.
While FIP isn’t perfect, it has made its way closer to the mainstream as more fans begin to understand its usefulness. Who knows? Maybe someday the calculation can be streamlined to better capture those pitchers like Kyle Hendricks and John Burkett who just don’t quite “fit” the formula.